
Cryptocurrency Prices Surge with XRP, SHIB, and Solana Leading the Way


The cryptocurrency market is buzzing, with XRP breaking key levels and Solana and Shiba Inu showing significant price movements. Ahead of the Ripple case decision, the market is tensely anticipating how these events will affect the further price dynamics of XRP.
XRP CoinMarketCap Price and Analysis
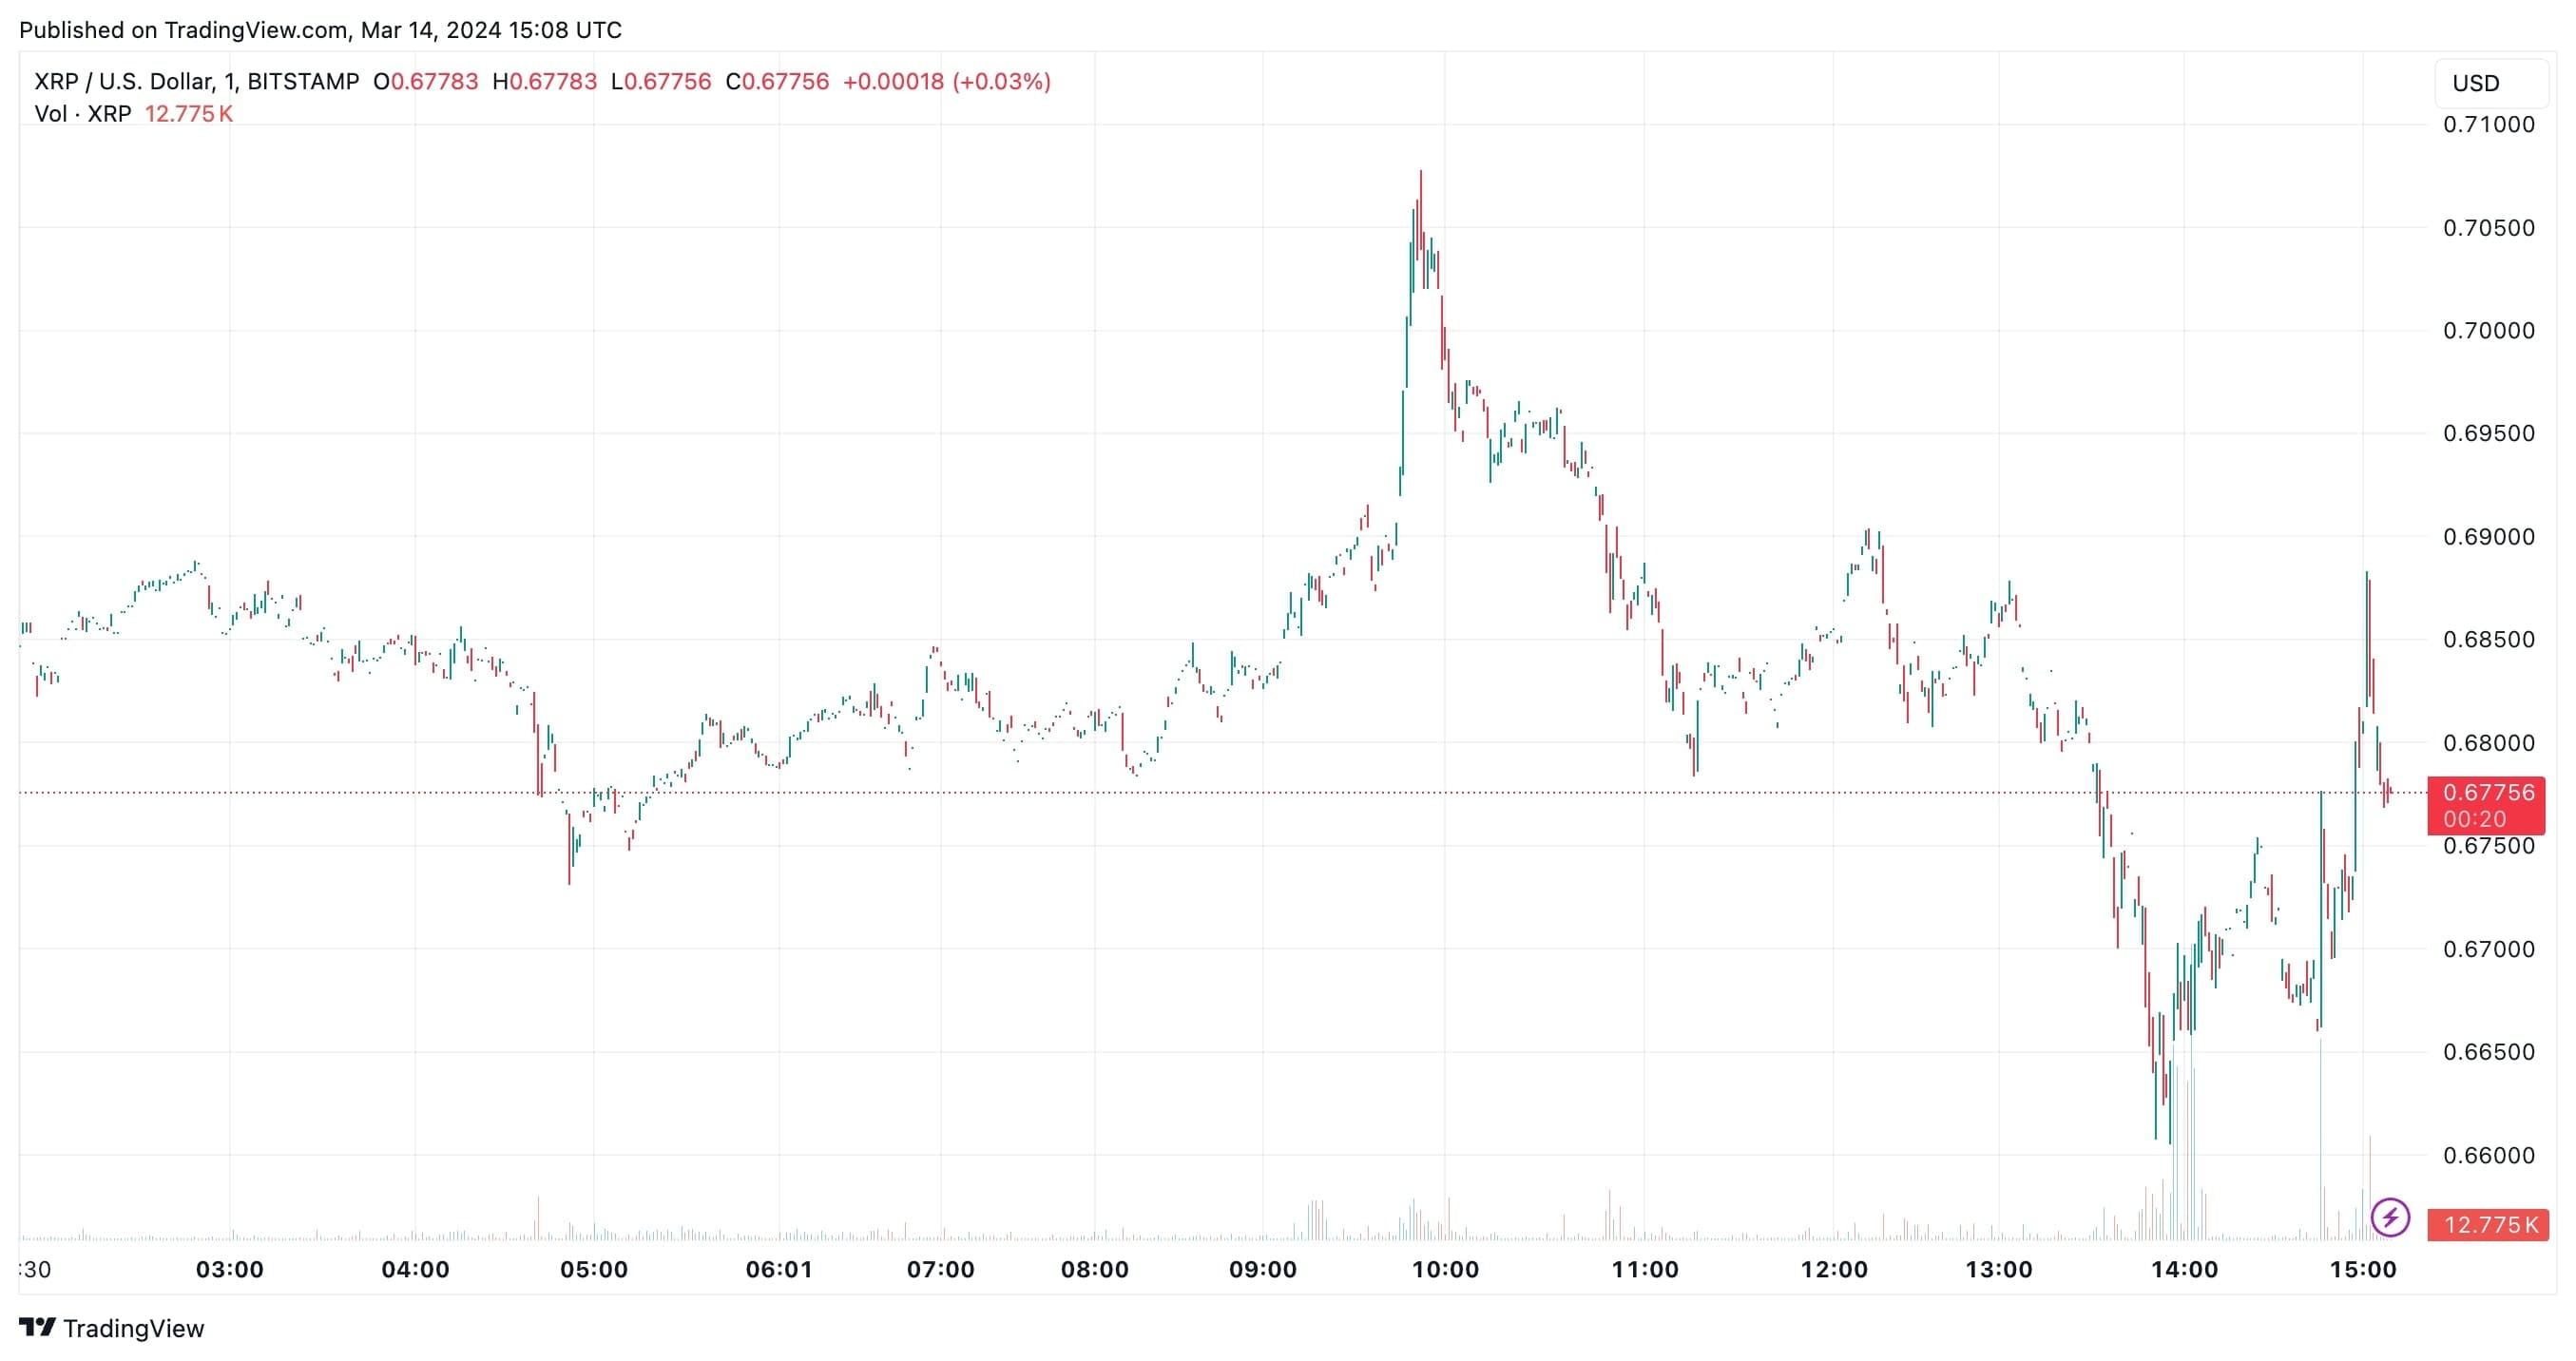
Source and Copyright © TradingView
What is happening with the price dynamics of XRP? In recent days, the value of the asset has risen noticeably, marking a significant upward trajectory from $0.53. XRP has overcome key resistance levels at $0.58, $0.6, and $0.65. At the time of writing, XRP is trading around $0.67, down 0.80% over the past 24 hours. The volatility is attributed to whale activity, according to Whale Alert.
March 22 is the deadline for the Securities and Exchange Commission's lawsuit against Ripple, which could potentially affect the price of XRP. From a technical perspective, XRP is moving between the $0.65 support zone and the $0.72 resistance zone. The RSI index is in the neutral zone at 50, reflecting the cautious sentiment among investors. Therefore, the next move of the coin depends on its thresholds. To revive the bullish trend, XRP needs to overcome the $0.76 resistance level. Conversely, the downward movement will begin as soon as the asset falls below the $0.61 support level.
Shiba Inu CoinMarketCap Price and Analysis

Source and Copyright © TradingView
On March 9, the SHIB CoinMarketCap price showed a three-year peak of $0.00004, after which the memecoin mania began to subside. Shiba Inu is trading at $0.000032, testing this resistance level. At the time of writing, the asset is up 2.22%.
SHIB's positive performance has been bolstered by recent activity in the market, including a significant acquisition of 332 billion SHIB by an unknown whale, as well as the continued daily burn of the coin. Nevertheless, from a technical perspective, there is a possibility that selling pressure will continue. In that case, the $0.000024 mark serves as initial support. Conversely, if the bulls manage to break the current resistance level, Shiba Inu could rise to $0.000040 and $0.000045.
Solana CoinMarketCap Price and Analysis
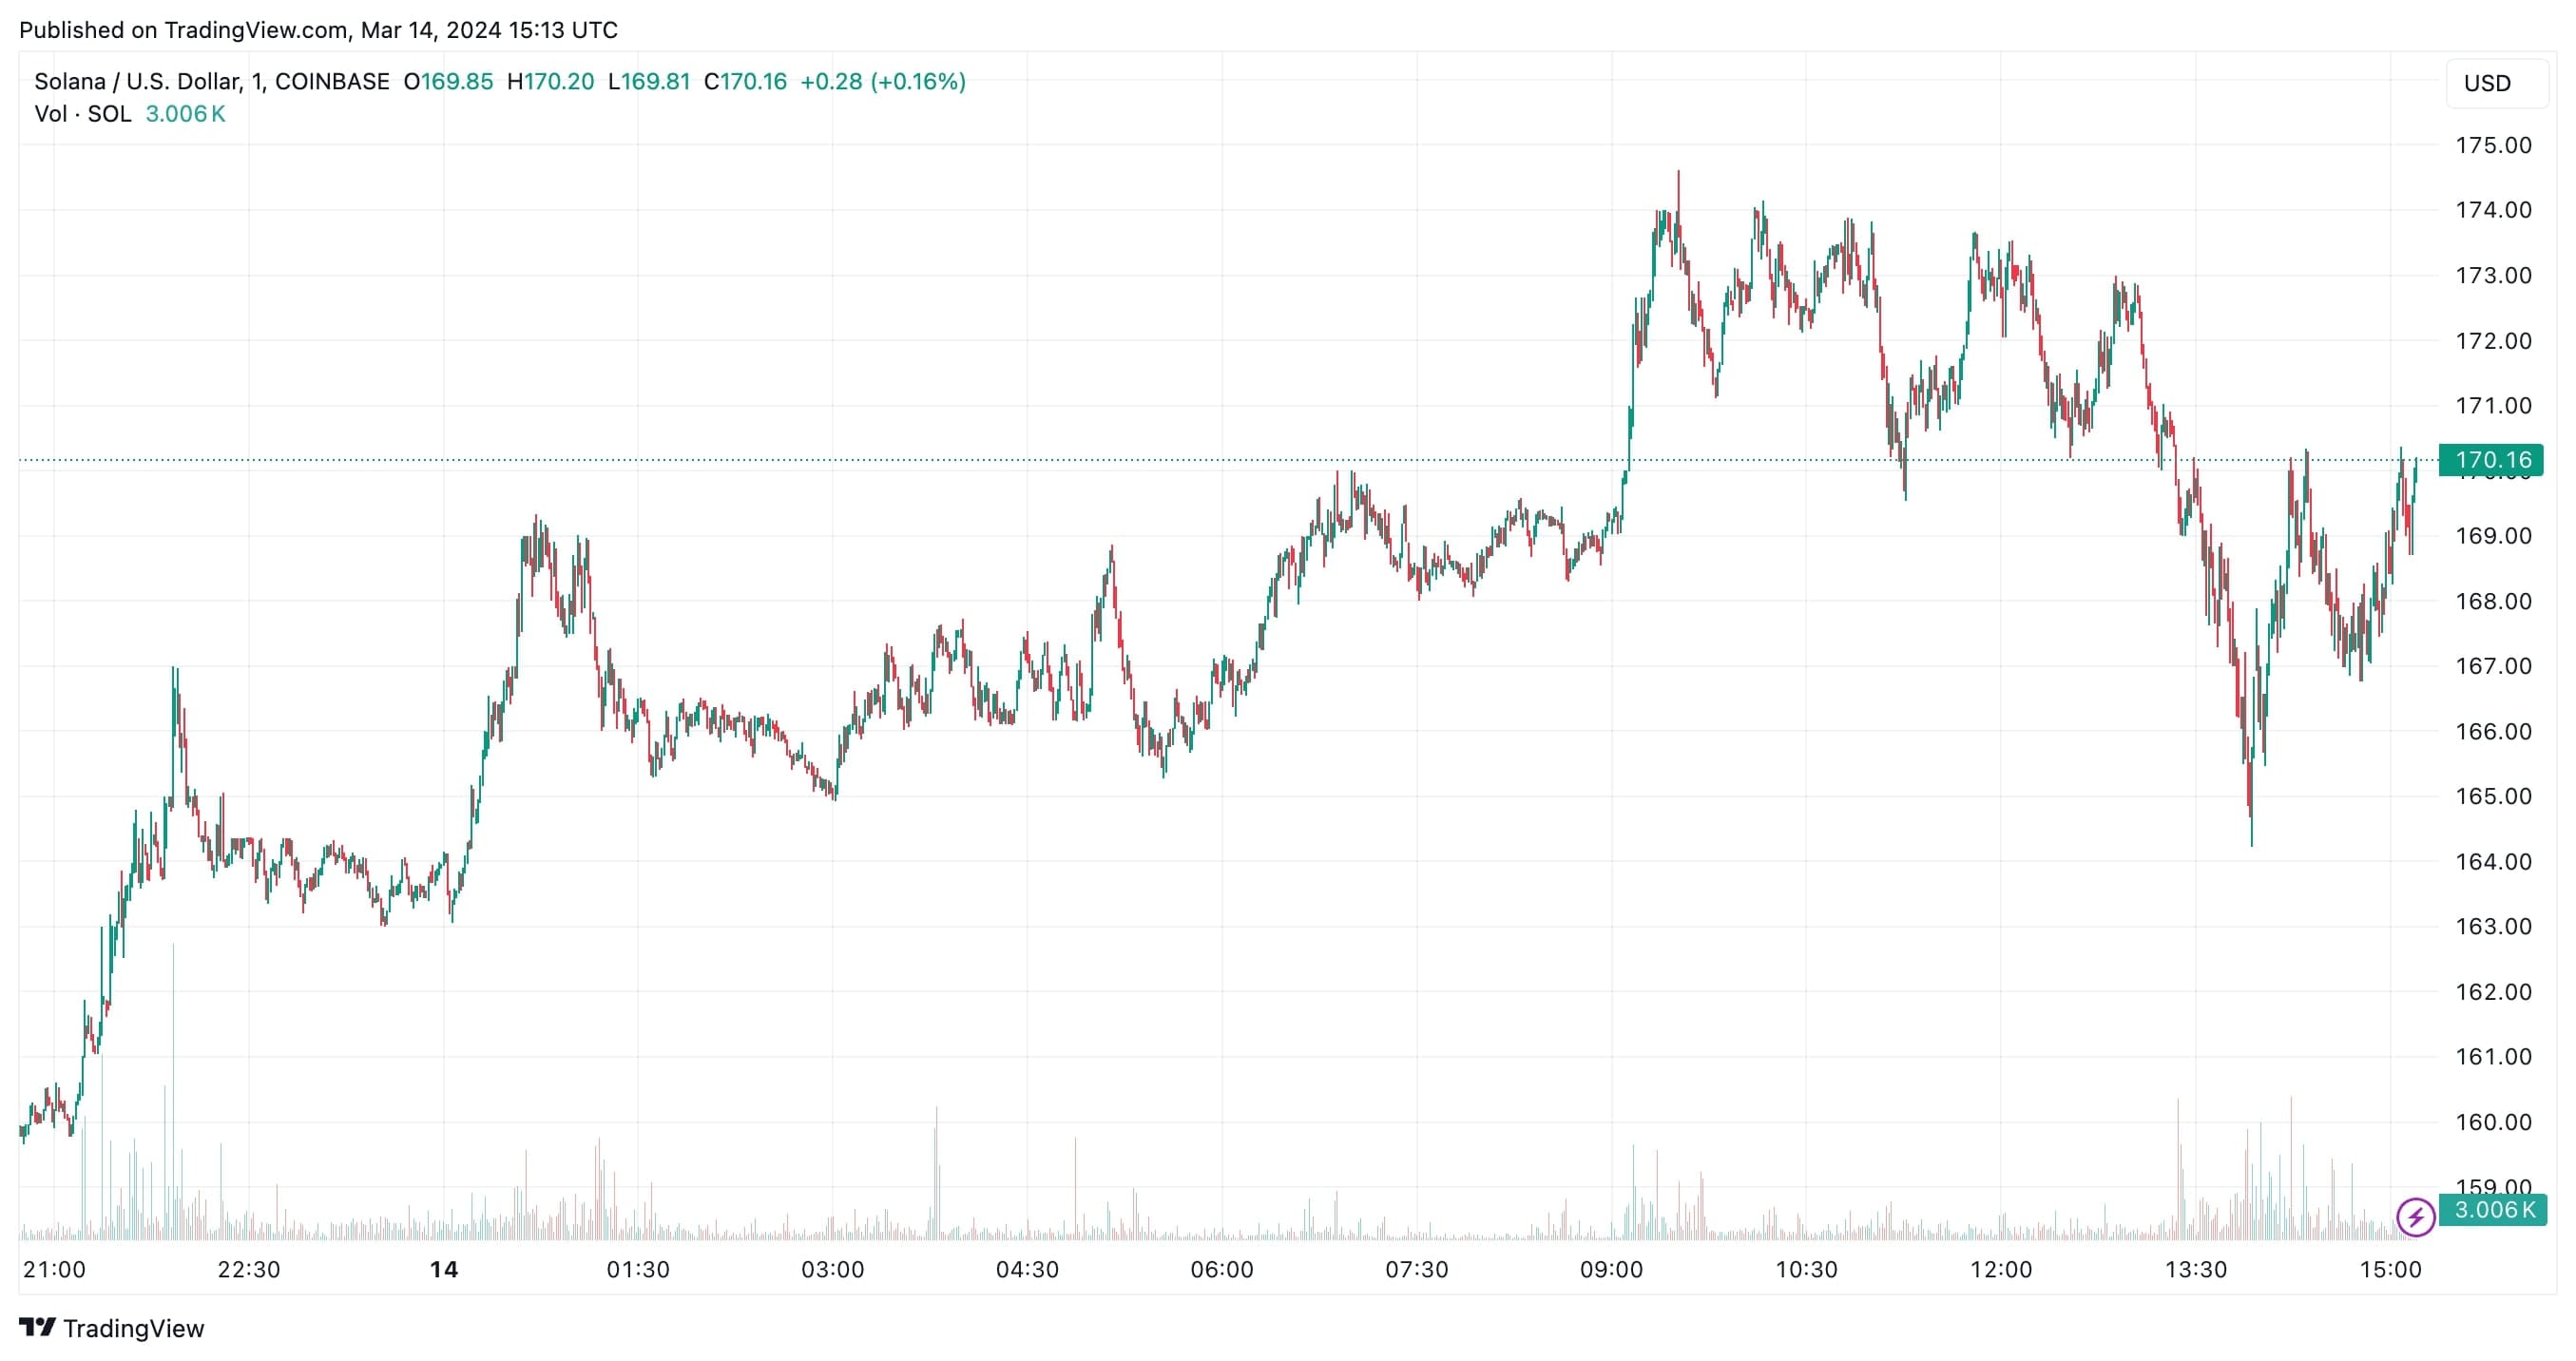
Source and Copyright © TradingView
The price of Solana has hit a two-year-high, surging 10% in the last 24 hours to the $174 mark. The cryptocurrency has risen 37% in the past two weeks and 43% in the past 30 days. The asset continues to strengthen due to increased activity on the network, as well as the increased popularity of Solana-based memecoins.
The RSI index is around 84, indicating increased buying pressure, which could have a positive impact on the price in the near term. Nevertheless, Solana is below the SMA 50 indicator and the SMA 200 indicator, indicating bearish sentiment. In this case, the most important support levels are $145, $139 and $135. The asset is now trading around the $165 resistance level. However, in general, the rest of the indicators point to an uptrend.
Pepe CoinMarketCap Price and Analysis


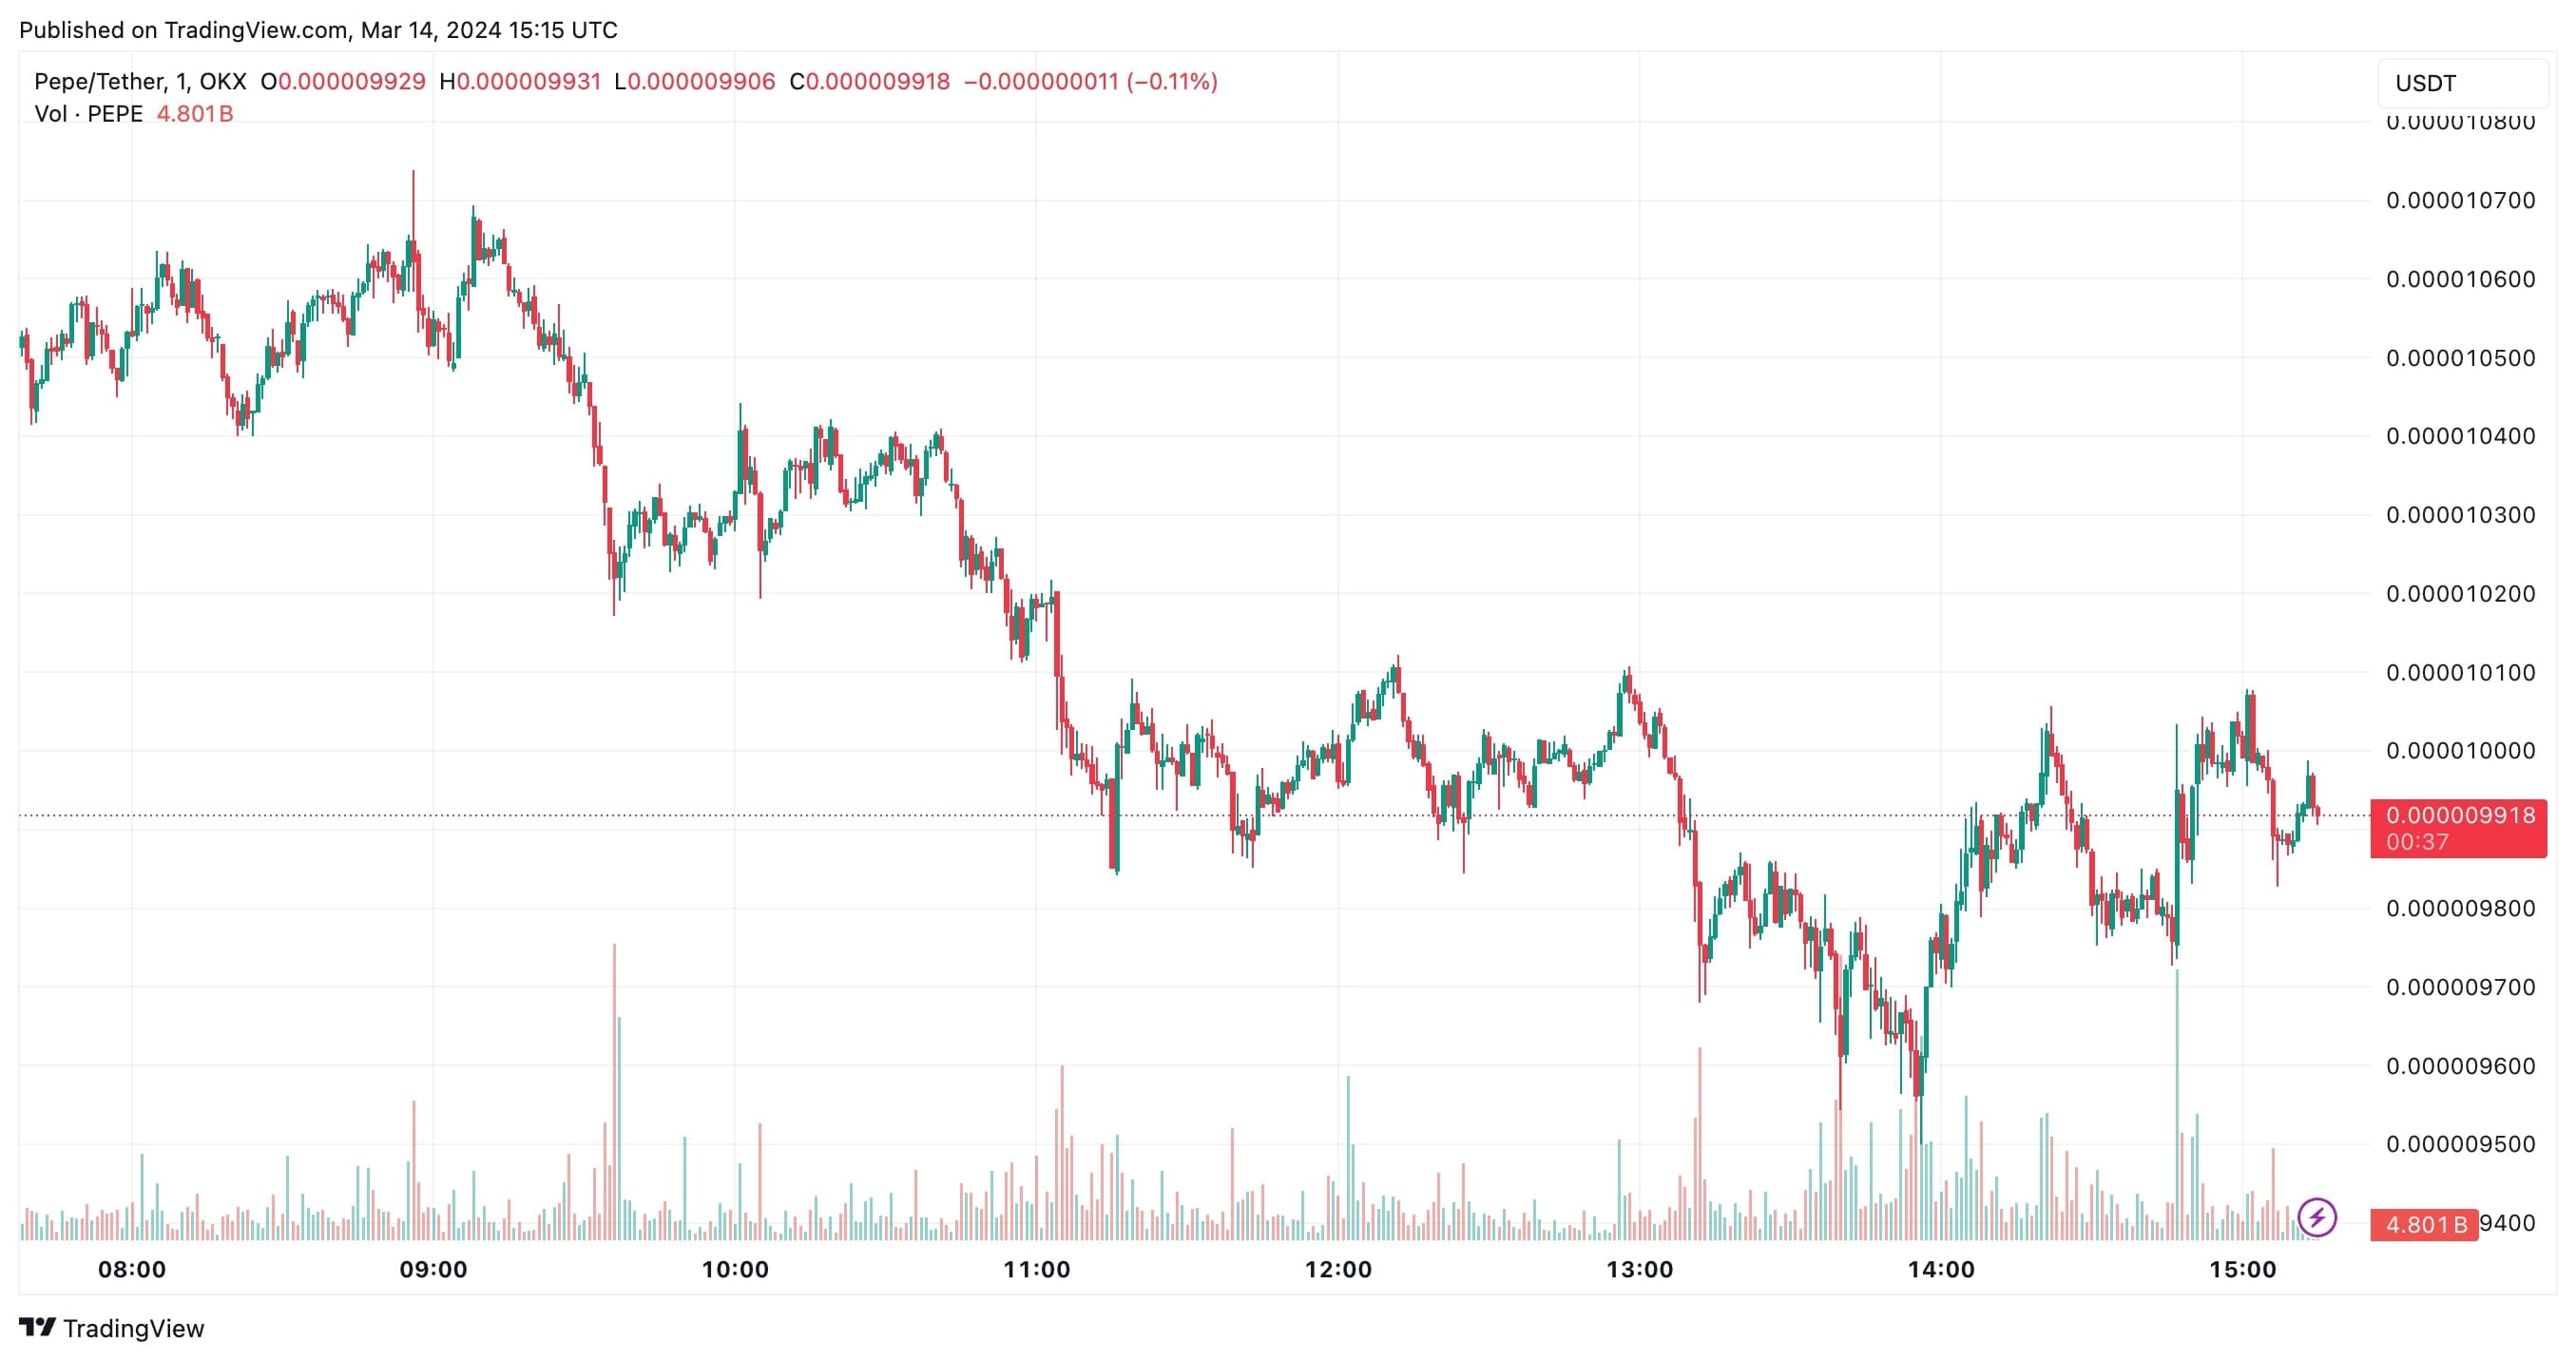
Source and Copyright © TradingView
Pepe is trading around $0.0000098 at the time of writing, having added 16% in value over the past 24 hours. Memecoin continues to receive strong support from the community, pushing the price to new heights.
Still, the Pepe price has been in a consolidation phase since forming a local high on March 5. However, the asset turned the $0.00000807 resistance level into a support level not too long ago, which increased buying pressure, pushing PEPE higher. RSI index indicates bearish mood, but such correction is quite expected, especially now investors are actively trying to push Pepe above the resistance level of $0.00000099. A break above will open a new window for growth. Indicators of 50-day EMA and 200-day EMA for PEPE point to a strong bullish momentum.
ETH CoinMarketCap Price and Analysis
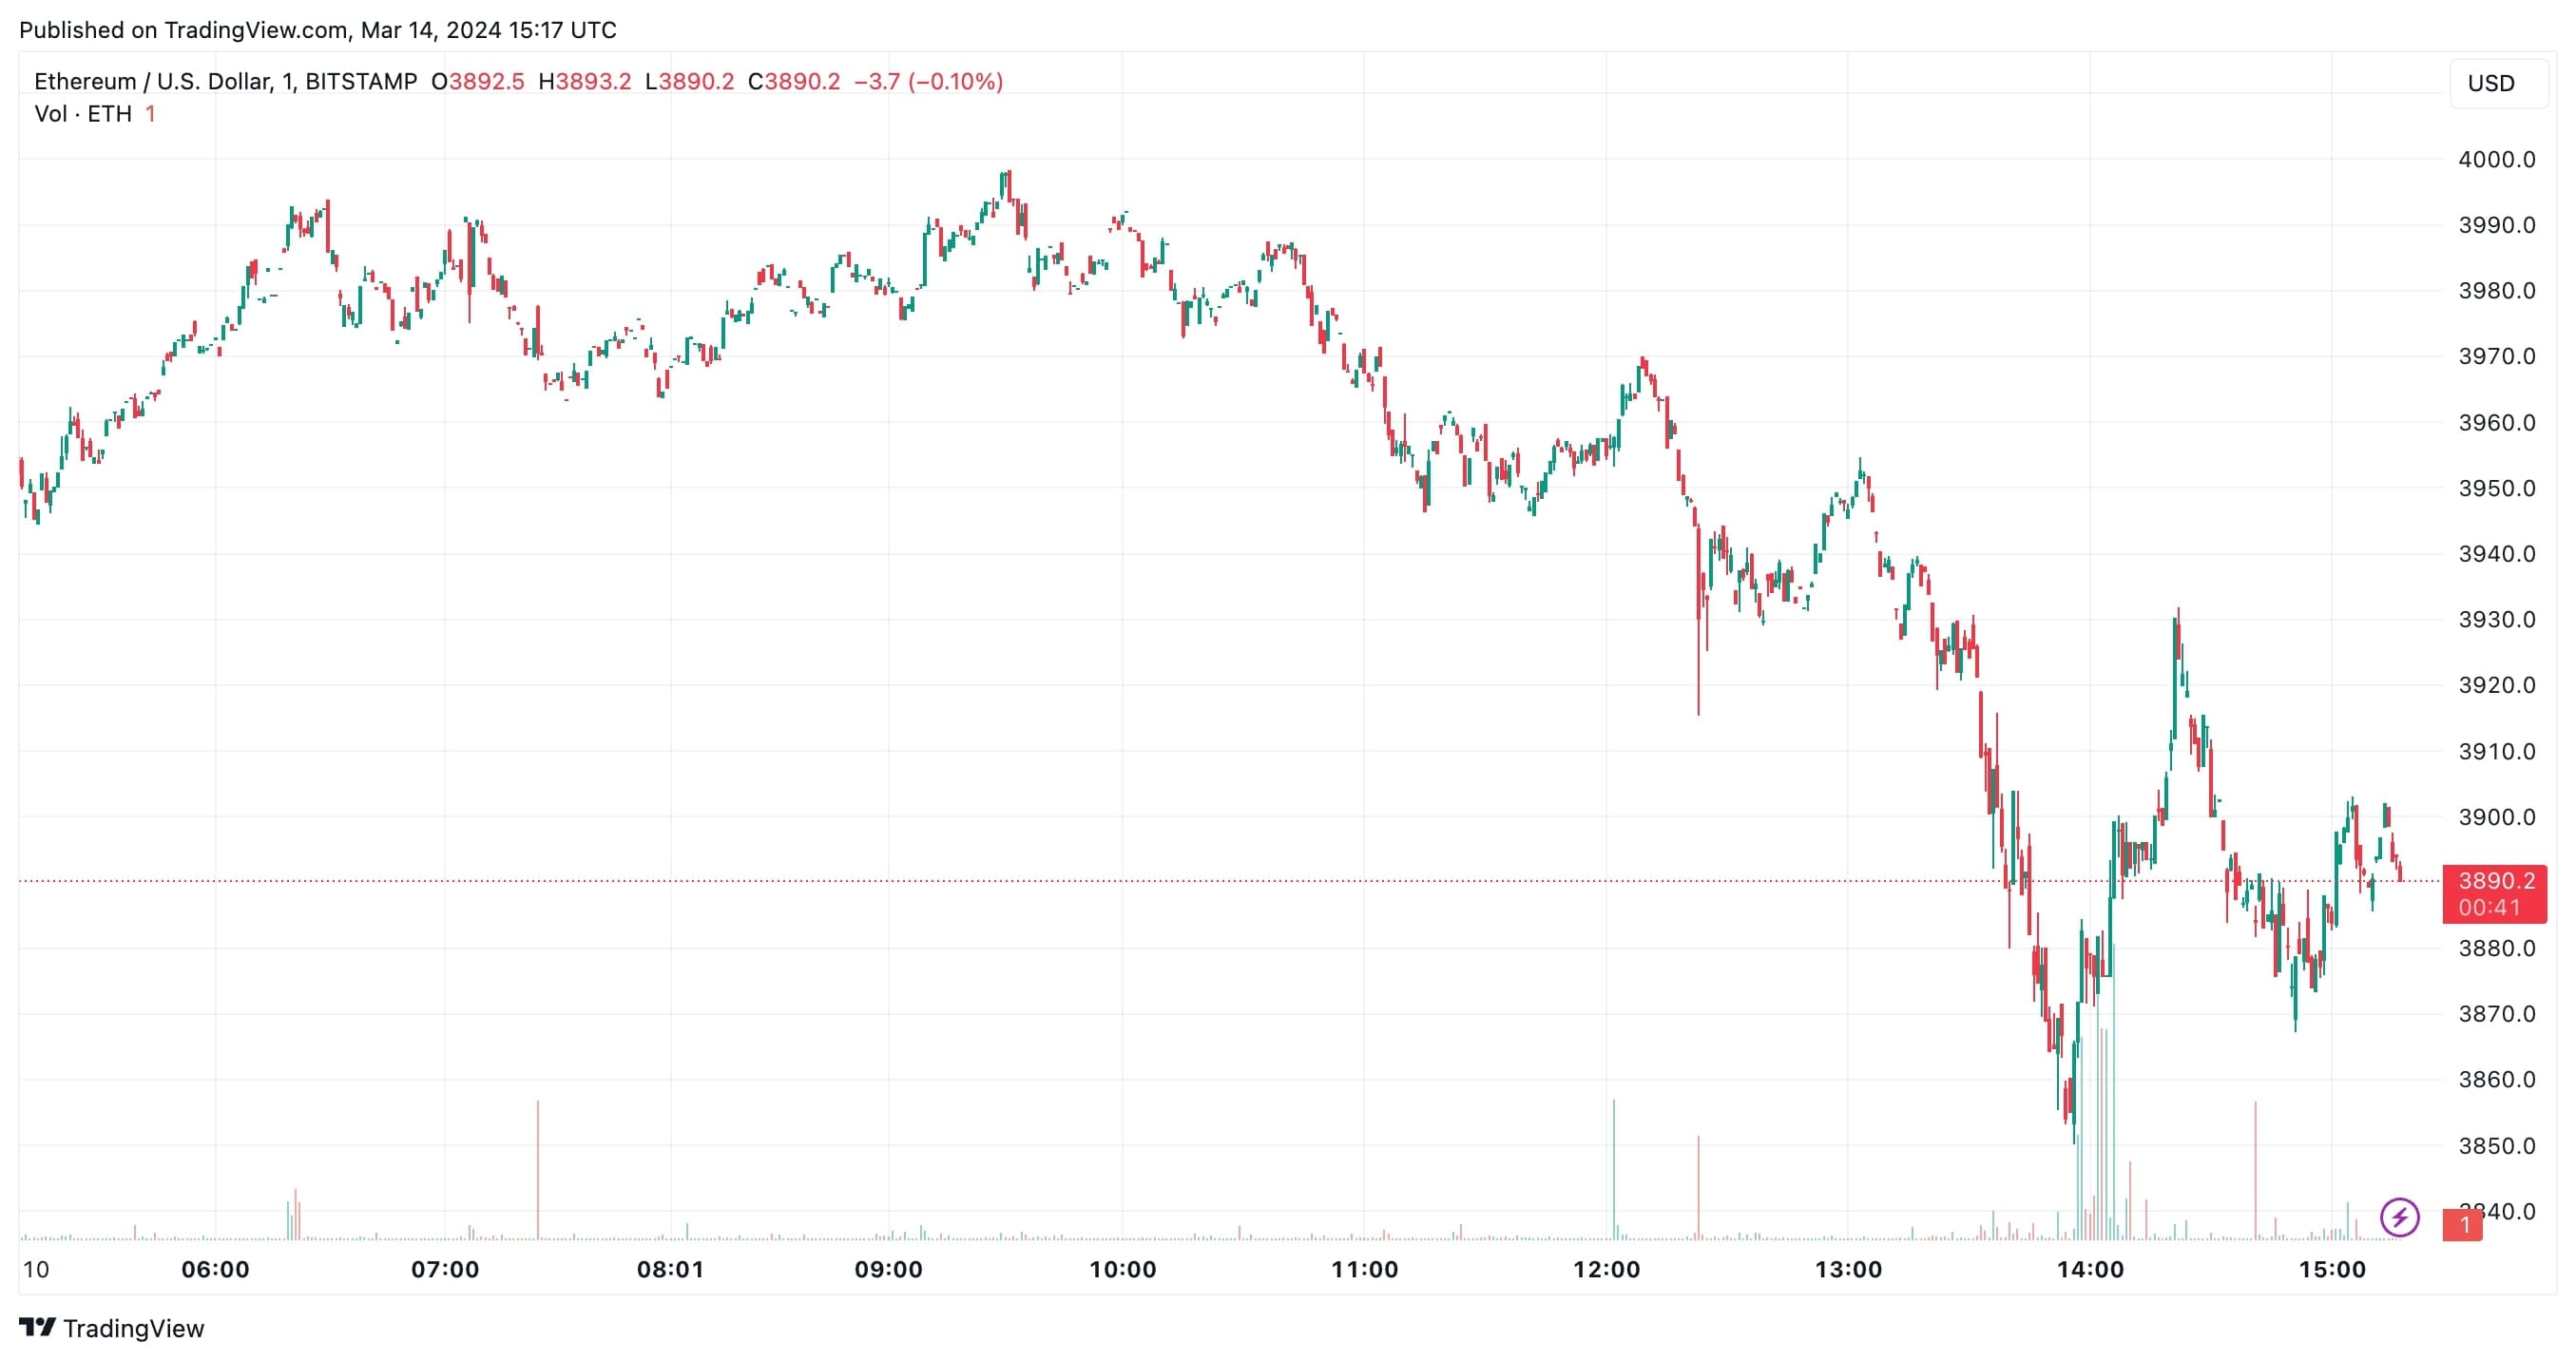
Source and Copyright © TradingView
Ethereum set a new all-time high at $4,080 this week. However, it seems that the expected Dencun network update did not have an impact on the further growth of the second largest cryptocurrency. The bulls failed to keep the asset around $4,000 and Etherem has fallen by 3% in the last 24 hours. The asset is now trading around $3,888, below its 50-day EMA.
For a new bullish wave, the asset needs to overcome the $3,950 resistance level. Further gains will take Ethereum to $4,025, $4,050, and $4,085. The asset is now near the major support of $3,880. If investors fail to keep ETH at this mark, the coin could face support at $3,830, $3,750 and $3,650.


